You can make a 2D graph if you have several points such as (1,2), (2,4) and (3,6).
You take a piece of graph paper and you choose an intersection point on the graph paper to be the origin.
You can then put the points on the graph paper as follows, go over to the right for a positive first value, then go up for a positive second value.
When learning graphs, you start out with systems that have an x-axis and a y-axis. The x-axis is horizontal and the y-axis is vertical. The graph will follow a story where one property depends on another property. As an example, aircraft temperature might depend on aircraft speed, with the temperature increasing as the aircraft flies faster.
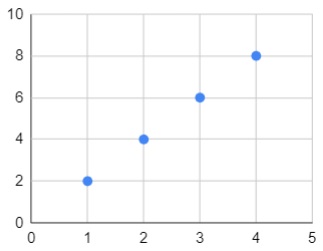
Graphs can be used to show Functions, and we will start with the example f(x)=2x.
- x=1, f(x)=2
- x=2, f(x)=4
- x=3, f(x)=6
- x=4, f(x)=8
The graph for this is shown below:
Note: when we say graph we are going to restrict our discussion to graphs that show points. There are other types of graphs, such as bar graphs, but they don’t let us do all the things we want to do.
As a bonus feature, we want to show you something else. In the example below we choose to just show points and to say that something is associated with each point. In this case, we have a number associated with each point. We could replace the numbers with something else, but for now we want to keep it simple.

There is a reason for this. We can only see three dimensions and when we use one of those to display a value it means we can only have two independent variables.
If we just show the points we can have three independent variables. Maybe we paint each point with a color and the colors indicate the value.
